How to Read Turbocharger Compressor Maps: A Guide for Power Seekers
When you're chasing horsepower, understanding compressor maps is essential to unlocking a turbocharger’s true potential. These maps aren’t just engineering diagrams, they’re the blueprint for matching airflow, pressure, and efficiency to your engine’s demands.
What Is a Compressor Map?
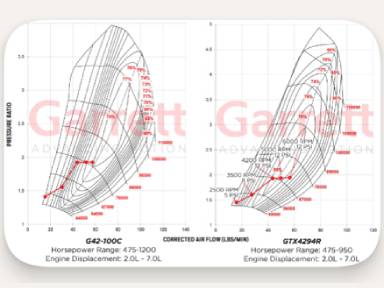
A compressor map is a graph that illustrates how a turbocharger’s compressor performs across different operating conditions. It shows:
- Corrected Airflow (X-axis): Measured in lb/min or kg/s, this represents how much air the compressor moves.
- Pressure Ratio (Y-axis): The ratio of outlet pressure to inlet pressure. This accounts for altitude and atmospheric changes, unlike simple boost pressure.

Key Features of the Map
Here’s what to look for when reading a compressor map:
1. Efficiency Islands
- These concentric rings show how efficiently the compressor converts shaft power into airflow.
- The center island (often 70–78% efficiency) is the sweet