How to Read Turbocharger Compressor Maps: A Guide for Power Seekers
When you're chasing horsepower, understanding compressor maps is essential to unlocking a turbocharger’s true potential. These maps aren’t just engineering diagrams, they’re the blueprint for matching airflow, pressure, and efficiency to your engine’s demands.
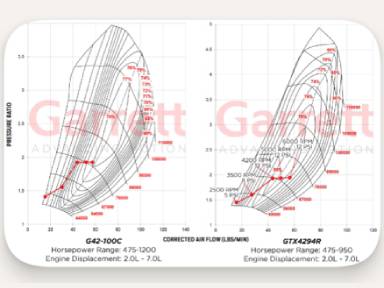
What Is a Compressor Map?
A compressor map is a graph that illustrates how a turbocharger’s compressor performs across different operating conditions. It shows:
- Corrected Airflow (X-axis): Measured in lb/min or kg/s, this represents how much air the compressor moves.
- Pressure Ratio (Y-axis): The ratio of outlet pressure to inlet pressure. This accounts for altitude and atmospheric changes, unlike simple boost pressure.

Key Features of the Map
Here’s what to look for when reading a compressor map:
1. Efficiency Islands
- These concentric rings show how efficiently the compressor converts shaft power into airflow.
- The center island (often 70–78% efficiency) is the sweet spot or where the turbo performs best.
2. Surge Line (Left Boundary)
- Operating to the left of this line causes unstable airflow, you can think fluttering boost or compressor “bark.”
- Surge under load is especially damaging. Avoid it by choosing a turbo that stays right of this line at low RPMs.
3. Choke Line (Right Boundary)
- Beyond this line, the compressor can’t flow more air, even if you spin it faster.
- Efficiency drops sharply, and charge air gets hot and turbulent.
4. Speed Lines
- These curved lines show compressor shaft speed (e.g., 80,000 to 140,000 RPM).
- Higher speeds mean more heat so intercooling becomes critical.
How to Use the Map
To plot your engine’s operating point:
- Estimate Airflow Needs
- A rough rule: 1 lb/min of airflow ≈ 10 flywheel horsepower.
- For 400 HP, you’ll need ~40 lb/min.
- Calculate Pressure Ratio
- If you want 15 psi of boost:
\frac{15 + 14.7}{14.7} ≈ 2.02
- Plot Your Point
- Find the intersection of 40 lb/min and 2.0 pressure ratio.
- Make sure it lands within an efficiency island and away from surge or choke zones.
Why does it matter?
Choosing the right turbo isn’t just about size, it’s about matching the compressor’s behavior to your engine’s needs. A well-matched turbo:
- Spools quickly without surging
- Delivers cool, dense charge air
- Operates in the heart of its efficiency zone

Misreading the map? You risk lag, heat, or even turbo failure.
A compressor map is a valuable tool for estimating turbocharger performance, helping users visualize airflow and efficiency across operating ranges. But interpreting that data and matching it to real-world driving conditions requires far more than charts, and, it’s where the seasoned experts at TurboKits.com shine! Their years of hands-on experience and product insight ensure optimal results. Together, we’ll turn good decisions into great builds!